In Tractorscope, SQL charts run live queries against a connected database and map the result columns into visual fields such as axes, series, labels, values, or table columns.
SQL charts are the core of Tractorscope. A chart runs a query against a connected database and displays the result as a visualization.
Basic workflow
- Open or create a dashboard.
- Add a chart from the dashboard toolbar. The chart editor opens straight away.
- Select the database for the chart.
- Write a SQL query.
- Run the query.
- Choose a chart type.
- Map result columns to chart fields, layers, or series.
- Adjust chart settings.
- Save the chart.
A new chart opens empty, with the SQL editor above and the preview below:
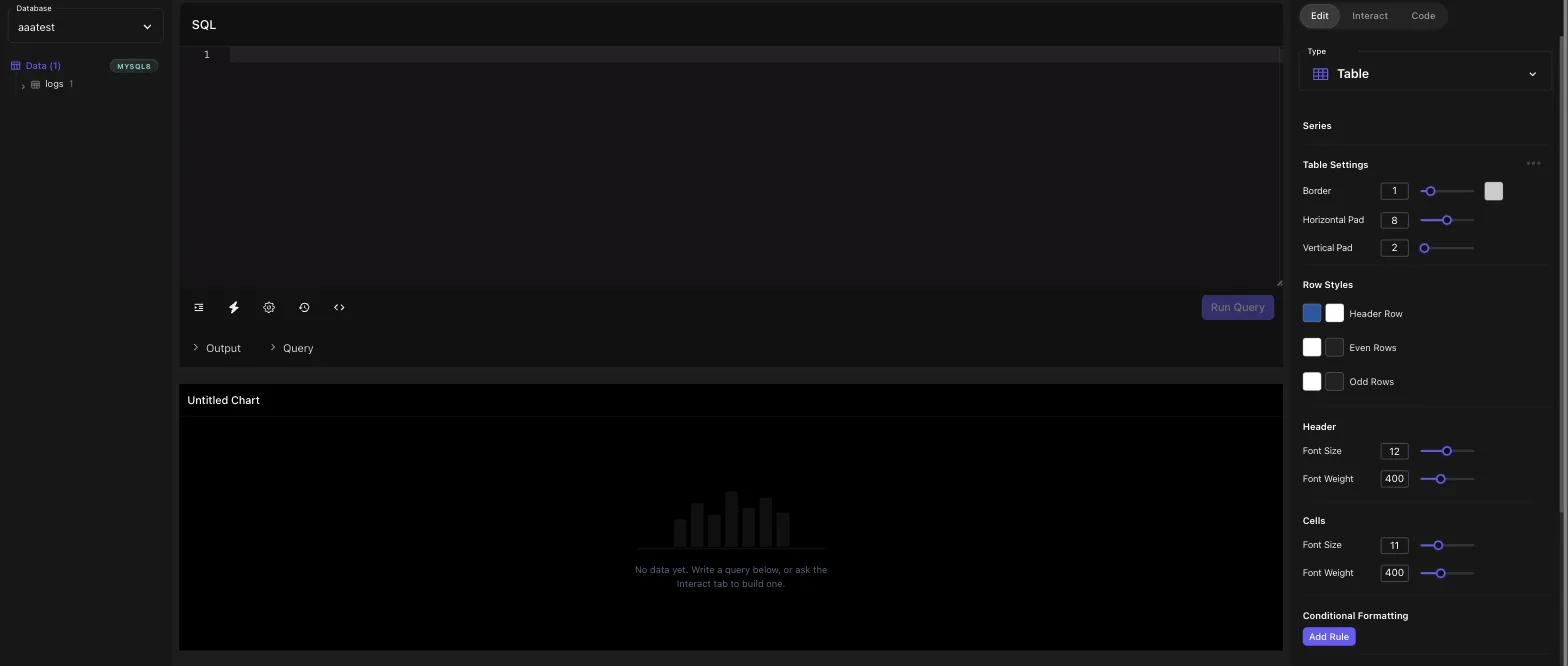
Query editor
The chart editor includes a SQL editor, run controls, formatting controls, chart preview, schema panel, and chart settings. Use the schema panel to inspect tables and columns while writing queries.
Pick the database first and the schema panel on the left fills with its tables and columns. Run the query and the results appear below, along with the row count:
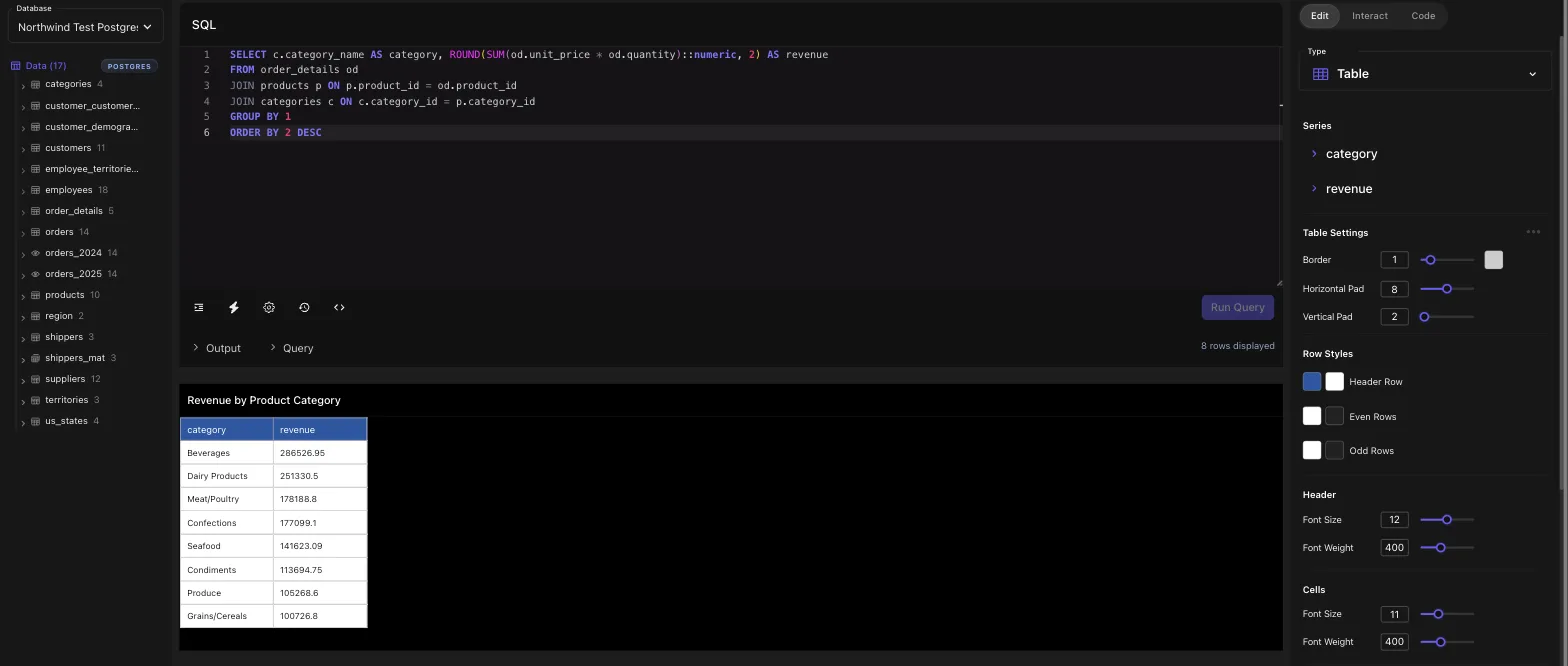
A chart left as "Untitled Chart" is named for you from its query after the first save.
Query results
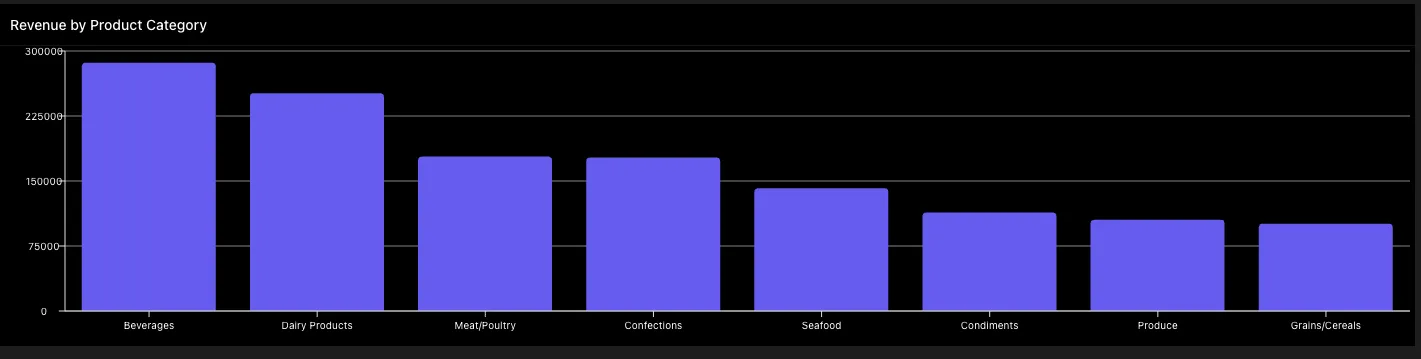
Tractorscope uses query result columns as chart fields. For example, a bar chart may use one column for the x-axis and another for values. A table chart can show many columns directly.
Choose the chart type from the Type control at the top of the settings rail:
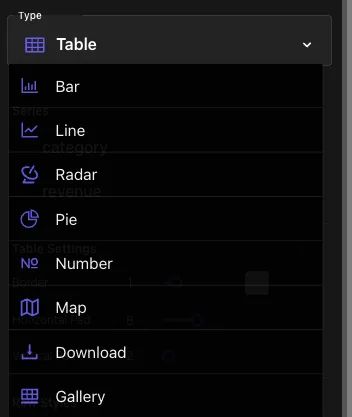
Each returned column then appears under Fields with the roles that chart type accepts. Here
category
is the x-axis and revenue
is the value: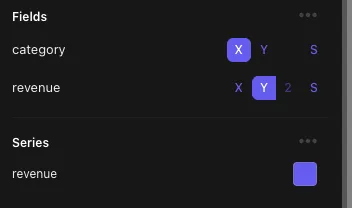
Filters in SQL
Dashboard filters can be used in SQL so viewers can change date ranges, aggregation periods, customers, or other values without editing the chart.
Tips
- Return only the columns the chart needs.
- Alias columns with readable names.
- Use aggregate queries for summary charts.
- Use table charts for detailed records.
- Use chart cache settings to balance freshness and database load.