Ask is a chat panel on a dashboard. A viewer types a question in plain language, and the answer is produced by running SQL against the rows the dashboard has already loaded to draw itself.
The design goal is narrow and worth stating up front: your data does not leave the browser tab. The question and a description of the dashboard's shape go to a language model; the rows do not. The SQL the model writes runs locally, against data that is already on screen.
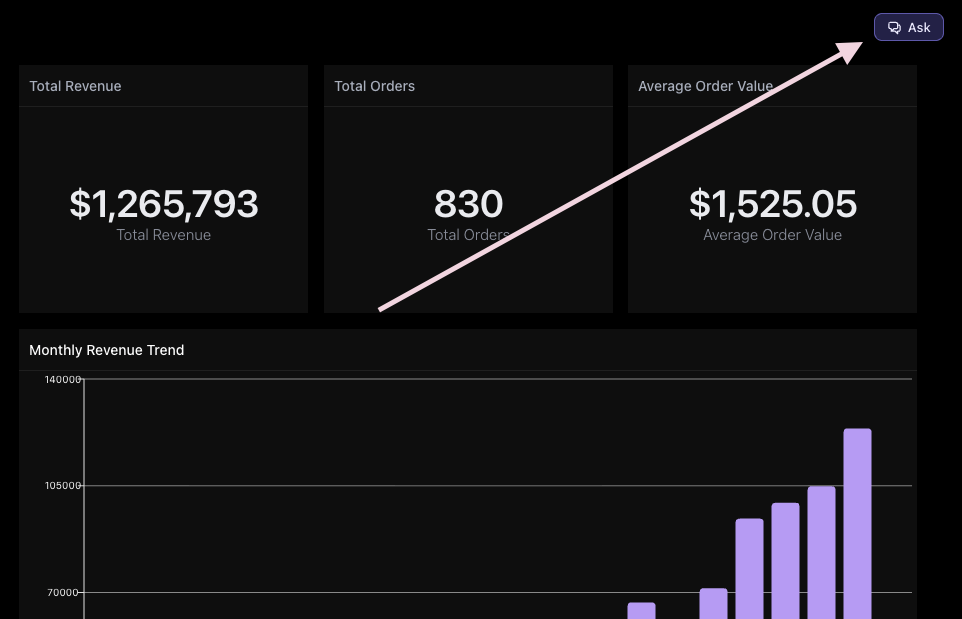
On a dashboard where Ask is enabled, viewers get an Ask button in the top right, alongside the filters.
How a question is answered
- Opening the panel loads a small analytics engine into the page and registers one table per chart, from the result set that chart already fetched.
- Tractorscope builds a catalog of that data: table names, column names and types, which column the dashboard treats as the x axis or the measure, row counts, the dashboard's active filters, and a three-row sample with every value replaced.
- The catalog, the question, and the recent conversation are posted to Tractorscope's API, which asks a language model for a SQL query and, when the question calls for a picture, a chart specification.
- The answer streams back to the browser over a websocket, so the explanation appears while the rest is still being written.
- The SQL is checked against a guard before it runs, then executed locally against the tables from step 1.
- Results render as a table, or as a chart through the same rendering pipeline every other chart on the dashboard uses.
When the panel opens it reports how many of the dashboard's sources it registered, and offers opening questions built from the columns it actually found — not a fixed list:
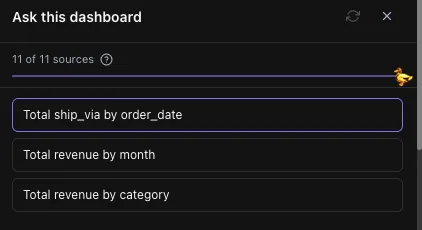
The panel opens beside the dashboard rather than over it, so the charts a question is about stay visible while it is answered. Every answer carries a Show SQL disclosure with the exact query that produced it.
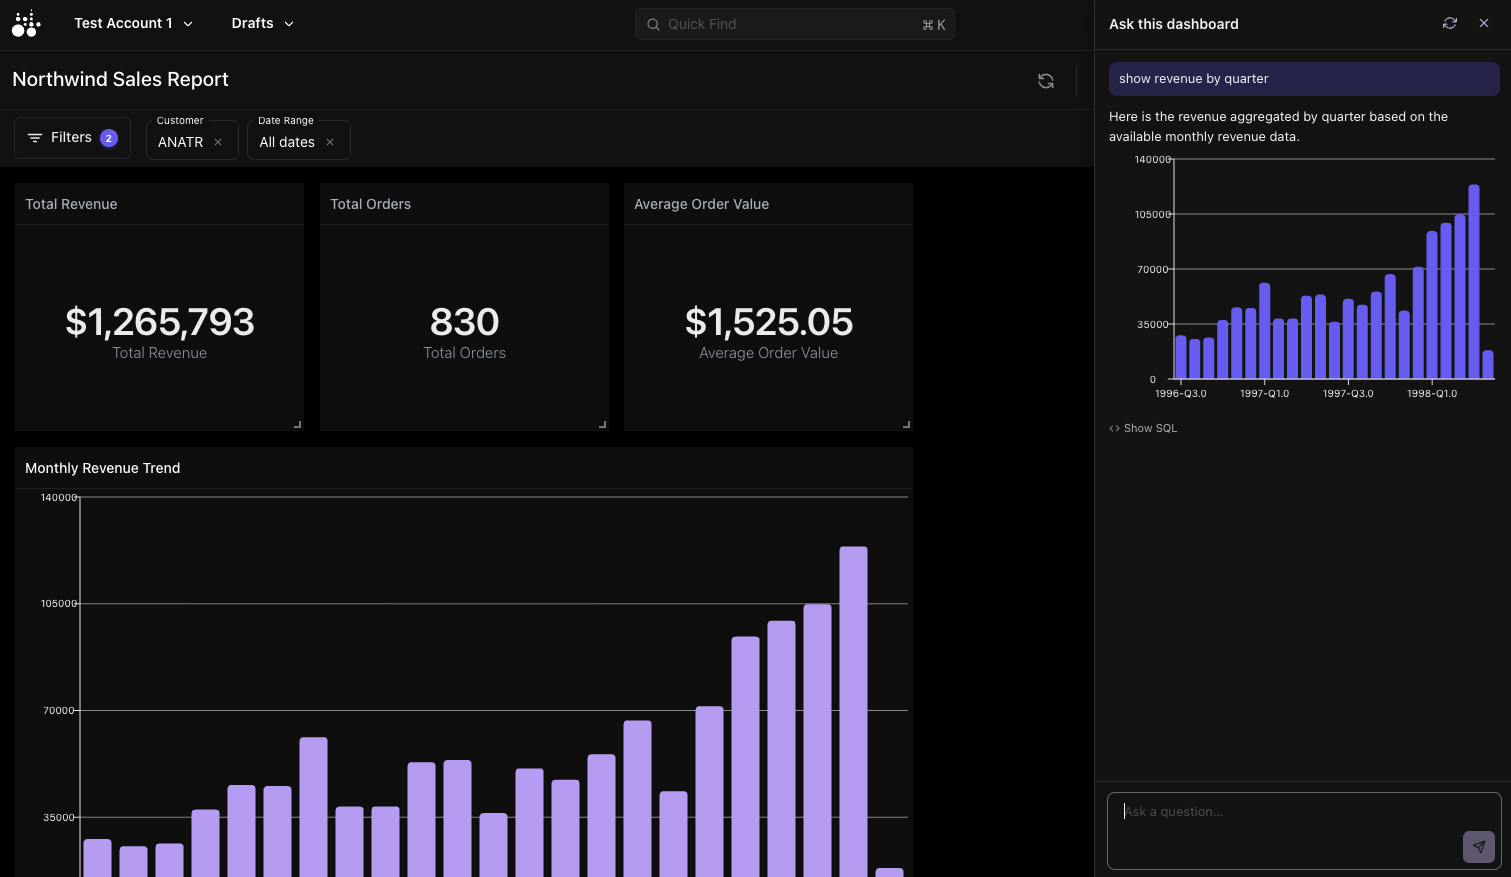
What the answers are based on
Ask can only see what the dashboard can see. Each chart contributes its own result set — the rows produced by that chart's query, with the dashboard's current filters already applied. Nothing extra is fetched, and no source database is touched by a question.
Two consequences follow from that, and both are worth designing around:
- Filters apply. Change a dashboard filter and the answers change with it, because the underlying tables were filtered before Ask ever saw them.
- Charts are usually pre-aggregated. A chart showing revenue by month contributes twelve rows, not the orders behind them. Questions that need the detail need the detail to be present.
Text, image, download, and alert widgets have no result set and are skipped.
Views give better answers
A View is a saved query published as a data source rather than drawn on the grid. It never takes a slot in the layout, and its rows are loaded only when someone opens Ask or inspects it.
Views appear as pills along the top of the dashboard, beside the Ask button. The menu on each pill reaches its schema and its rows:
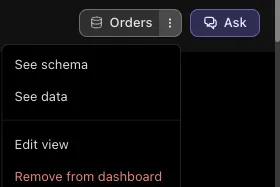
Views are the answer to the pre-aggregation problem. Publish a row-level View — orders, tickets, sessions — and Ask can group, filter, and compare across it, instead of working from summaries each chart already reduced for its own picture. Ask also prefers Views when suggesting opening questions.
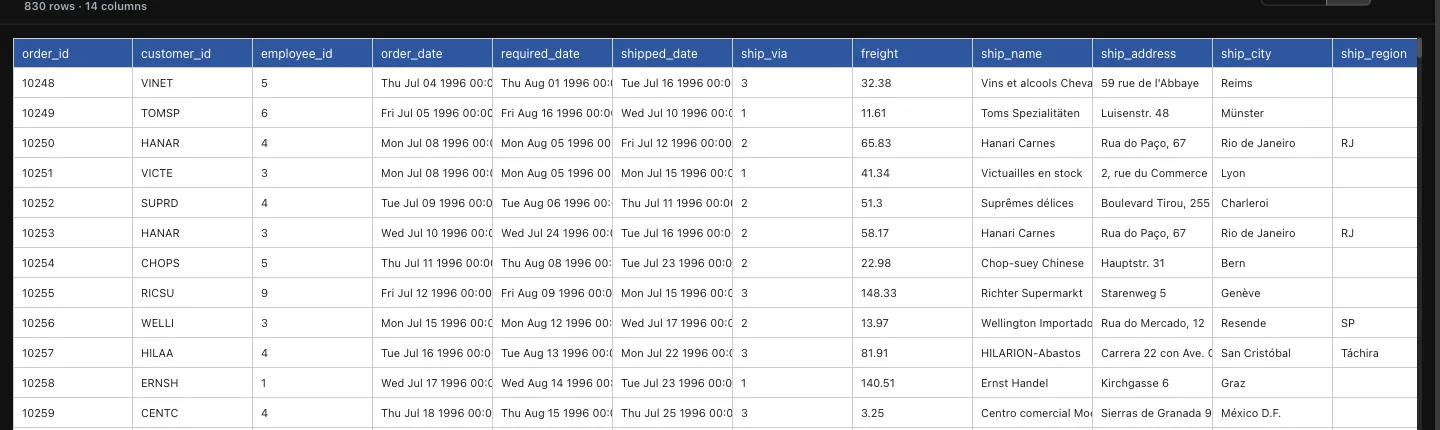
Where a chart of revenue by month contributes twelve rows, an Orders View contributes every order:
What leaves the browser
Only these things are sent to Tractorscope's API and on to the model:
- The dashboard name and chart count.
- Table, column, and chart names, column types, and the role each column plays.
- Row counts, and whether a result was capped or sampled.
- The names of the dashboard's filters and which values are applied.
- A three-row sample per table in which every value has been replaced — strings become xxxxand numbers become999999, so column shape survives and content does not.
- The question, and up to ten previous turns of the conversation.
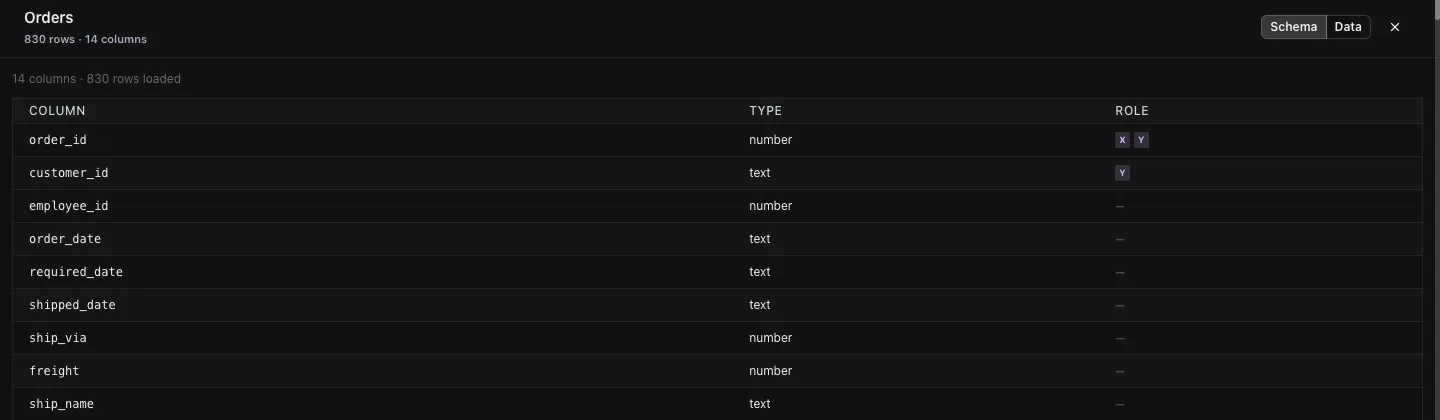
A View's schema panel is the clearest picture of what that catalog looks like — column names, the type each one resolved to, and the role the dashboard assigns it. This is sent; the rows beside it are not:
Result rows, cell values, and anything the SQL returns stay in the browser. When a query fails, the database error is sent back so the model can correct its own SQL — up to two attempts — and that error text is the only thing about a failure that leaves the tab.
Technical pieces
DuckDB compiled to WebAssembly. The analytics engine runs inside the page, in a web worker. Each chart's result set is registered as a table, so model-authored SQL gets real joins, aggregates, window functions, and date handling without a server round trip and without a second copy of your data anywhere.
The engine is deliberately built without its filesystem and HTTP extensions, and runs single-threaded. Single-threaded avoids the cross-origin isolation headers a threaded build requires, which would break the signed URLs charts load their data from. Leaving the HTTP extension out means model-authored SQL has no network primitive at all — there is nothing for a query to reach out to.
A SQL guard. Every statement is checked before execution. Writes and schema changes are rejected, as are the DuckDB-specific ways a statement can reach outside itself — attaching databases, installing extensions, copying to a path, and the table functions that read from a file or URL. A rejected query is shown to the viewer rather than silently retried; the model does not get a second chance to find a phrasing that slips past.
Caps and timeouts. A chart answer is capped at 10,000 rows and a table answer at 500. Any query is cancelled after ten seconds. The registered tables share a 250 MB per-session budget, and a chart whose result exceeds what is left is sampled rather than dropped — with the catalog saying so, so a partial total is never reported as an exact one.
Result rendering. A chart answer goes through the same chart store, validators, and renderer as the rest of the dashboard, so it inherits the same chart types: bar, line, pie, funnel, radar, number, table, and map.
Where the model runs. The language model is called from Tractorscope's servers, not from the browser, so no model API key is ever exposed to a viewer or embedded page. Tractorscope currently uses OpenAI as the model provider. Every turn is recorded against the account for usage and budgeting.
Memory. Chart result data is held for the life of the open page and released when it closes. Nothing is written to disk, and nothing is cached between sessions.
Turning Ask on
Ask is off by default and is enabled per dashboard, under Dashboard Sharing → Ask. There are three independent switches:
- In the app — for people signed in to your account.
- On shared links — for anyone you have shared the dashboard with.
- In embeds — for anyone who can load the embed URL.
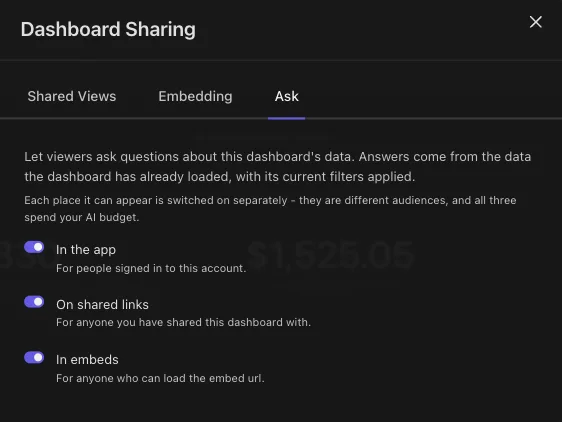
They are separate because the audiences are separate. An embed URL is a bearer token that may never expire, so opening Ask to your own team is a very different decision from opening it to every page that can load an embed. Each switch is checked on the server against the surface a question actually arrived from, so a question from an embed cannot be answered on the strength of the in-app setting.
The Ask button also hides itself on a dashboard with nothing to query — one with only text and image widgets has no tables to register, and offering the button there would only produce failures.
Limits
- Questions are capped at 2,000 characters, and the catalog at 64 KB. A dashboard with a very large number of wide tables can exceed the catalog limit.
- Rate limits are counted per dashboard, per hour and per day. In-app usage is allowed 120 questions an hour; shared links and embeds are allowed 20, because a leaked URL should not be able to run up an unbounded bill.
- Questions stop being answered once the account's AI budget is exhausted.
What Ask cannot do
- It cannot query your database. It only sees result sets the dashboard already loaded.
- It cannot see beyond the current filters.
- It cannot write, modify, or delete anything, in DuckDB or in your database.
- It cannot reach the network from inside a query.
- It cannot answer about a chart that failed to load, and says which ones did.
Best practices
- Publish a row-level View for the questions you expect people to ask, rather than relying on charts that are already aggregated.
- Give charts, Views, and columns names a person would recognise. Those names are most of what the model has to work with.
- Turn Ask on per surface deliberately, and leave it off for embeds unless you intend the embed's audience to have it.
- Check the SQL behind an answer with Show SQL before acting on a number that matters.
- Keep an eye on the loaded-chart count in the panel. Answers describe the charts that loaded, not the ones that did not.